
The more you know, the more you realize you know nothing.
--Socrates
I’m in the middle of trying to bootstrap a new product that’s roughly aligned with logging. Coincidentally, during a consultation with a client, I mapped out on a whiteboard a rough guide to logging.
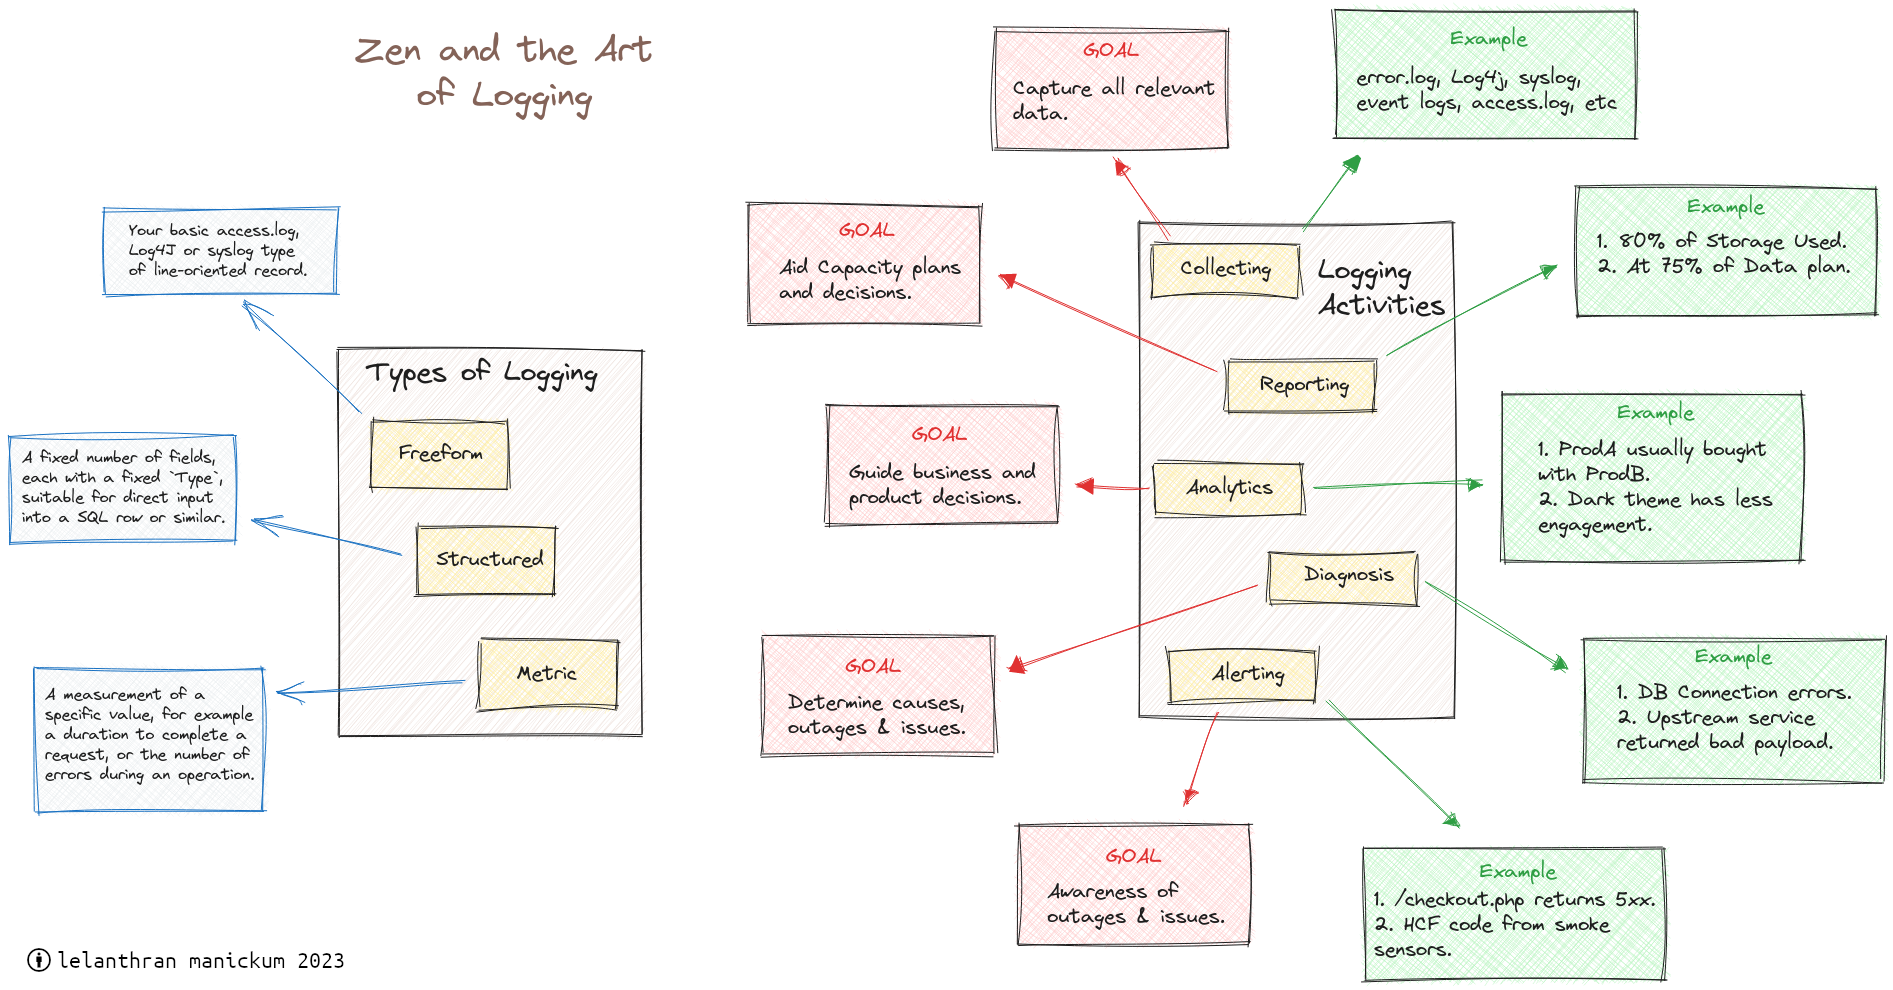
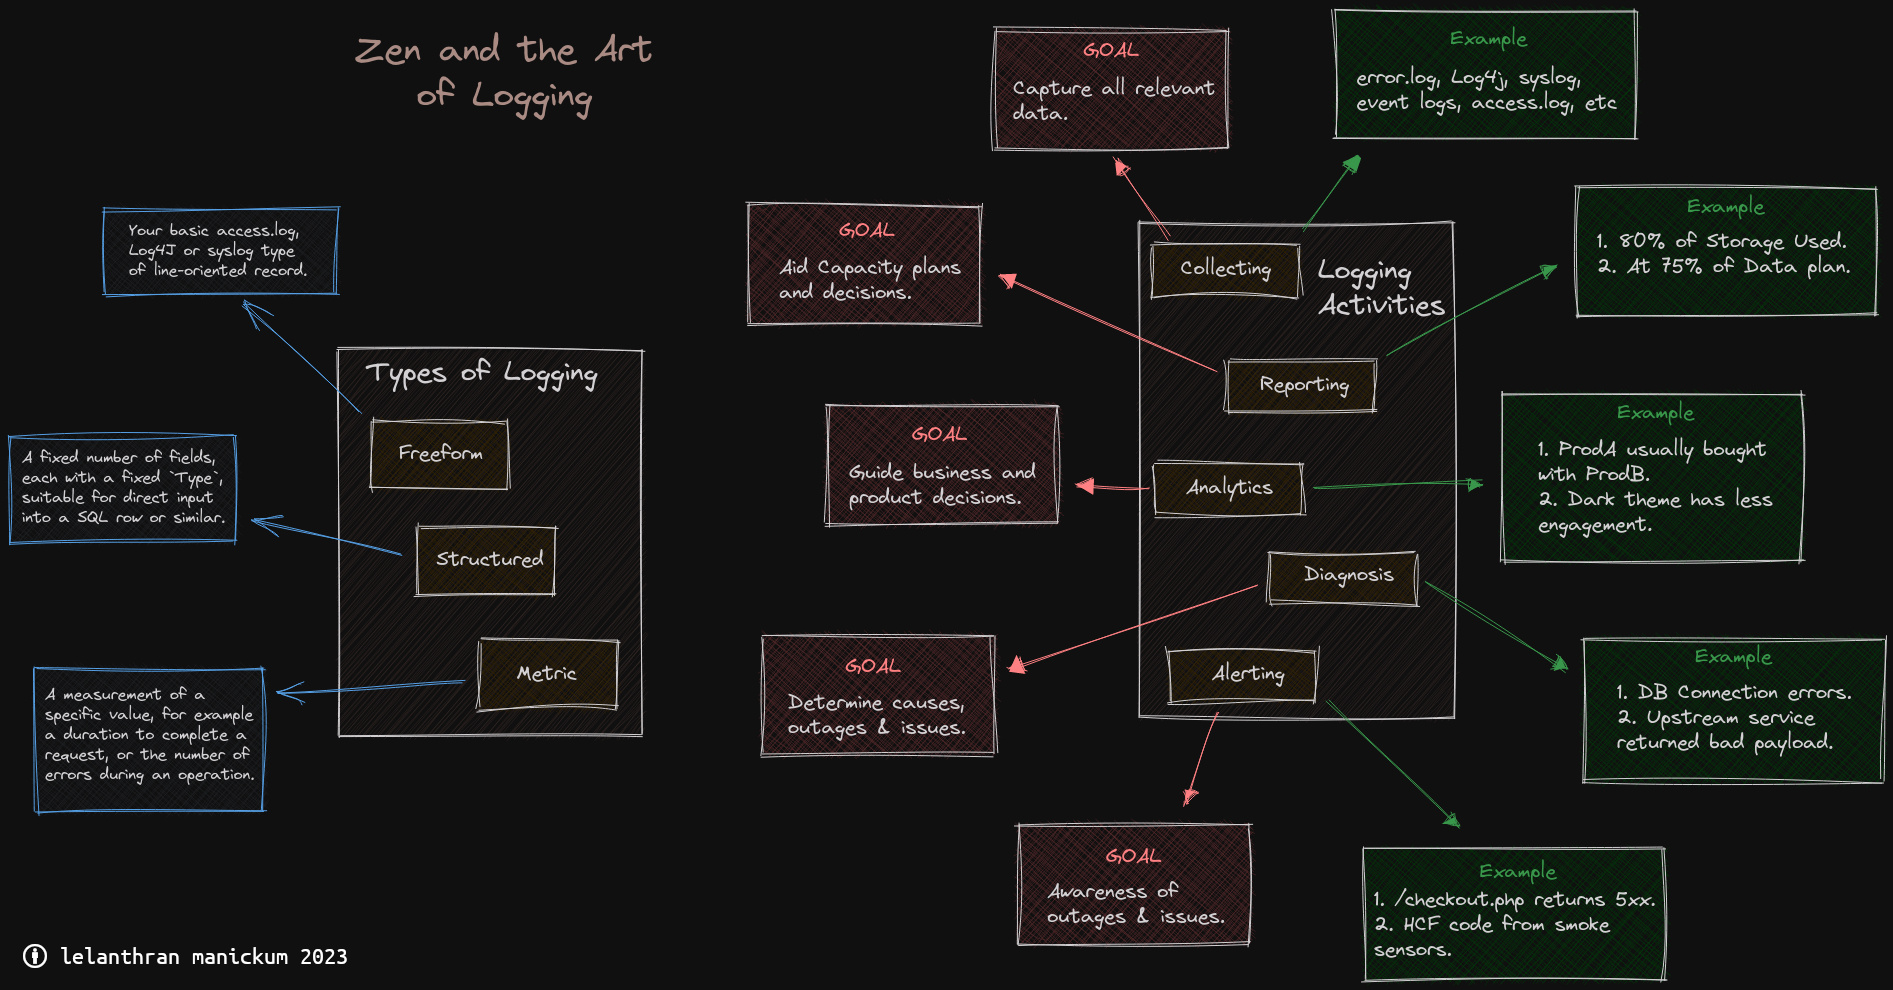
Here’s the diagram, redrawn on a computer. Right-click and view image in new tab for a full size image. Simply clicking the image downloads it.
There are three types of logging, all confusingly called “logs” in various contexts:
| Data | Examples |
|---|---|
| Freeform | Your basic access.log, Log4j or syslog type of line-oriented record. |
| Structured | A fixed number of fields, each with a fixed Type, suitable for direct input into a SQL row or similar. |
| Metric | A measurement of some specific value, for example the duration to complete a request, or the number of errors during an operation. |
Logging is more than simply writing the data to a file or database. Each activity related to logging or the logs must have clean and clear boundaries between them.
| Activity | Goal |
|---|---|
| Collecting | Capture only relevant data. Not as easy as it sounds: all data will be relevant to someone. |
| Reporting | Aid capacity planning decisions, like "Do we need more servers?", or "Must we shard the DB?" |
| Analytics | Guide business requirement decisions, such as "Is this page useful to customers?", or "Which product most needs more ad budget?" |
| Diagnosis | Determine causes of issues, for example "Why did the $FOO service stop responding for 10 minutes last night?" |
| Alerting | Reduce downtime. "This domain does not resolve anymore!", or "The upstream service is non-responsive!" |
I omit Tracing from this; it is often not worth the trouble and the times you will actually be hobbled because of a lack of tracing is vanishingly tiny.
An example of a Report is a chart/graph/table indicating that the usage of a particular resource is trending in a particular direction (for example, DB server disk utilisation increasing at a rate of 100GB/month).
Reports are an aid in capacity planning.
Similarly, an example of Analytics is a chart/graph/table showing that the most popular page experienced less engagement from older users, or that premium users could benefit from a downgrade/upgrade, etc. This can be helpful to business when they consider product offering and product market fit.
Analytics focuses on the performance of the business and the products, not the performance of the systems.
An example of a Diagnosis is when the Ops team trawls the access logs to determine if a suspected breach occurred.
Diagnosis is an after-the-fact investigation into an issue. Generally, you’d perform a diagnosis when alerted, which brings me to …
Alerts are generated in response to metrics or system parameters that are out of range. There are two basic types of alerts:
For example, an alert of Type 1 could be “Memory pressure is peaking at 80% total memory”. This alert, when received at 0200 in the morning, can safely be ignored until the workday starts.
A Type 2 example Alert could be “Handler for /checkout/ generates 5xx errors”. This alert, when received at 0200 in the morning must be acted upon immediately. It cannot wait.
The audience for Reports, Diagnosis and Alerts is the ops team.
The audience for Analytics is the product team. In fact, everyone not on the Ops team is potentially an audience for Analytics.
The AGENT is the entity under automated inspection.
Your application server needs inspection (requests/second, CPU load, Memory Pressure, etc) so it will be an agent. Another agent could be your PostgreSQL cluster. Sometimes your user’s desktop computer can be an agent (under inspection for uptime, crash reporting or similar).
Even the Raspberry Pi controlling your space heater under your desk will be an agent if it is under inspection.
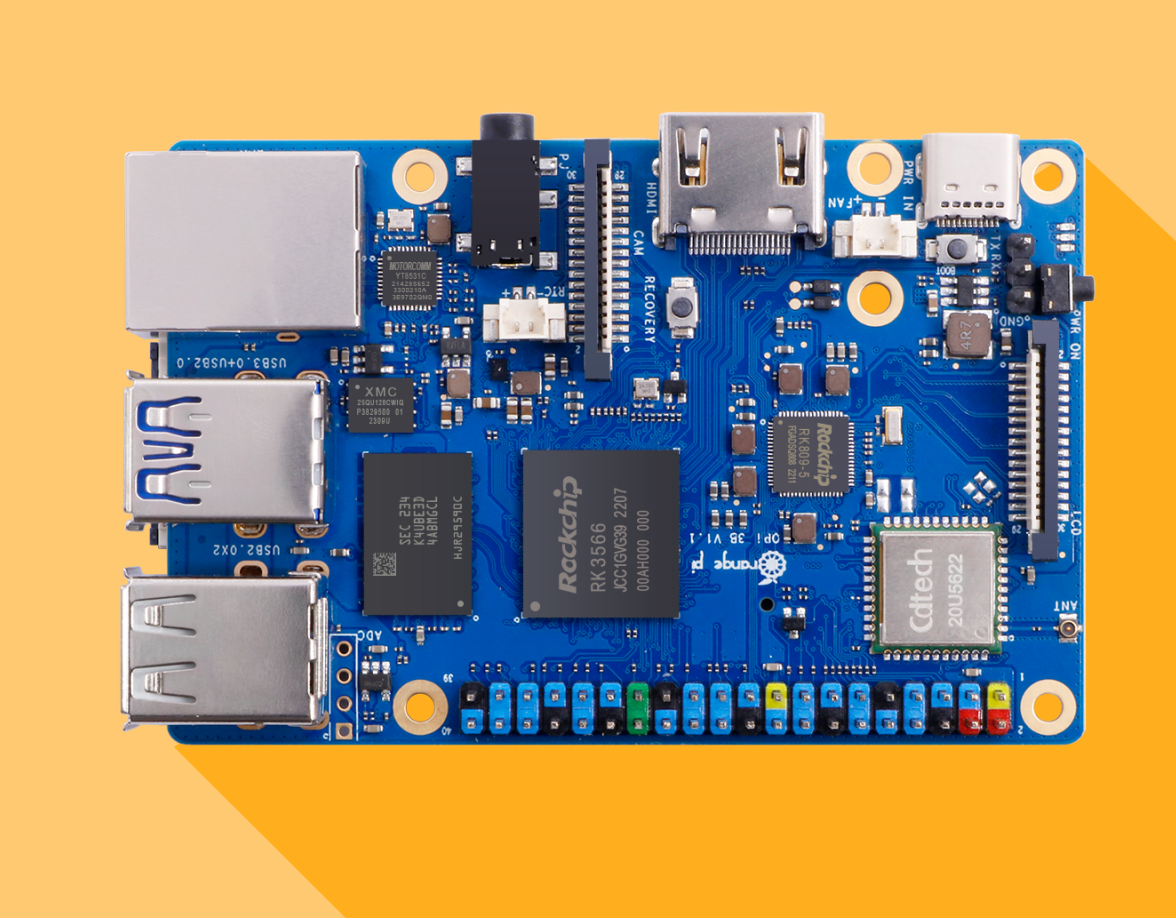 |
| Meet … Agent Orange |
The MONITOR is the entity that performs the automated inspections. You might find several of them in a large organisation. In an especially large system they may be tiered so that one Monitor simply consolidates the data from other Monitors which are actually talking to the Agent.
Many of the professional monitoring tools support a tiered architecture to handle excessively large networks.
Charts and Graphs compresses all that juicy data into some actionable information. You might have multiple Visualisation tools, each of which import the Monitor data into a format (such as ClickHouse or similar) suitable for quick retrieval.
An agent will log data (into a text file, a DB, syslog, etc) while a monitor periodically pulls that logged data.
An agent can, at the same time, push urgent alerts to the monitor.
Thus the distinction between a log record and an alert record is made by the agent. A log record is pulled by the monitor (or pushed by the Agent - see below) at periodic intervals. An alert record is pushed to the monitor immediately.
This can get very hairy very fast: the monitor needs to both listen for incoming connections as well as periodically make outgoing connections.
This means that you may lose some data occasionally when the Gods of the Firewall Rules throw a hissy fit and then your monitor can’t find a route to the agent.
The Log Record data is primarily for reporting, analytics and diagnosis, so it is usually okay to miss a few records here and there. An Alert Record cannot be lost, dropped or missed.
This is an area where even a little bit of effort returns outsized benefits when downtime of your service or application costs thousands of dollars per second. Timeout alerts can reduce the cost of your software eventually falling over1 immensely.
Alert records also has the best signal-to-noise ratio of any data you collect.
Any alert needs to be acted on immediately by the Monitor. Someone must be notified, someone must take action. 2 The alert, and the sent notification must be logged for future reports.
Here is where the majority of problems will arise:
A partial mitigation is to have the Agent periodically upload the collected logs to the Monitor, which will generate an alert if an Agent is silent for more than a specified duration.3
At this point your reporting and visualisation tools will pull this data and generate (hopefully) useful reports and (also hopefully) useful analytics.
They probably provide a nice dashboard too. The good ones cost money. The popular free ones are still pretty good. The bad ones are written in-house.
At some point, a historical diagnosis may be needed (if your system fell over, for example), so it might not be a bad idea to prepare for that by looking at tools specifically for that eventuality.
 |
| A popular, but flawed, log-retention strategy |
You should also probably decide on the retention strategy for logs. Generally, for diagnosis, anything more than 30 days is overkill. For analytics and reports, the tools themselves would consolidate, aggregate or downsample when storing the data that they need, and their retention would depend on what sort of information you require from them.4
Some or all of the above pieces of technology exist. Some are standalone while some are a suite that covers one or more pieces of functionality.
I’m not going to recommend any here as this blog doesn’t do advertisements. I do recommend that you keep abreast of the technologies, even if you aren’t using them.
Doing an internet search only when your system is down is almost guaranteed to be fruitless. Knowing what your options are before deploying a logging solution is the smart way to do things.
Be smart.
Everything eventually falls over. Everything.↩︎
Even if the action is simply "We'll look at this in the mourning". That’s not a spelling error.↩︎
This has downsides too - you might accidentally build a self-DDoSing network when you have thousands of Agents all trying to send you their logs.↩︎
Its nice to compare, for example, your product engagement metrics to this time last year. You cannot do that if you only have the last 30 days of data.↩︎